What is Web Analytics?
Let’s start with the most obvious question. What is Web Analytics?
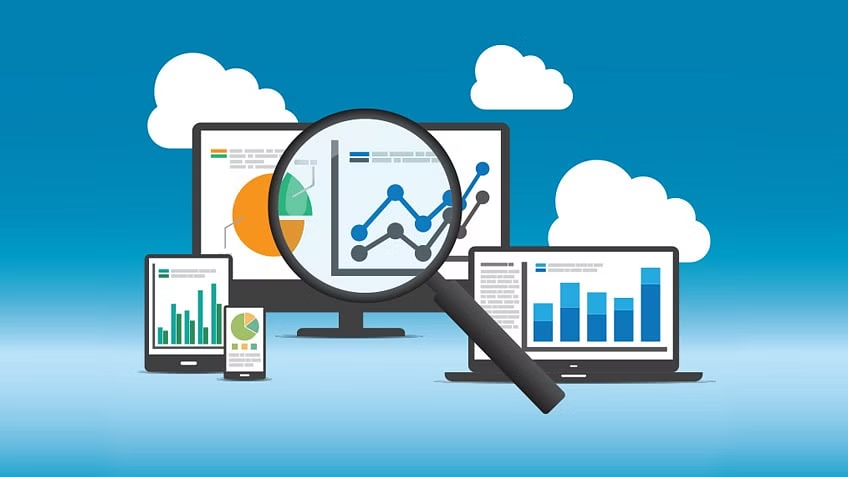
Web analytics is the process of collecting, reviewing, and analyzing data to understand user behavior on a website.
Your website is up and running and now it’s time for you to take the data from your website to figure out who is viewing your site. The existing tools work by taking user data such as the number of clicks on links, the number of visitors, bounce rate, and pageviews. With this information, you can see what consumers like and don’t like about your website and be able to make improvements. Once you make the necessary changes, you can review your goals and objectives to maximize results with web analytics.
How do I maximize results using web analytics?
I have compiled the best steps to take to maximize your results. These steps are simple and easy to follow! Let’s go through them one by one.
Steps to use Web Analytics:
- Select a toolset
- There are many options when selecting what software to use for analytics. One of the most popular ones is Google Analytics. Google Analytics was presented by Google in 2005 and has over 44 million users. Google Analytics tracks and reports website traffic as well as mobile app traffic.
- Google provides careful step-by-step instructions for using Google Analytics. Click Here!
- 2. Gather Insights
- To maximize results with web analytics, you will need to gather some data that will be useful to maximize your results.
- Some useful ones are the number of users to your site, new or returning users, what browser they are utilizing, the bounce rate, and keywords users are searching.
- 3. Analyze Results
- Knowing how to analyze your data is an important step to maximizing results. Below is an example of a couple of insights!
- Number of users meaning how many people are entering your site.
- Bounce Rate: The percentage of visitors of those who leave after viewing one page. The lower the better!
- 4. Compile Results and Make Improvements
- When compiling results, I like to have them all on one page where I can go back and look at the results when needed! You can compile the results on Google Analytics using different types of graphs, funnels, or map overlays!
Time to Improve
You have now done the work of gathering insights, analyzing, and compiling your results. Now, it is time to take your results and make improvements to your site to improve your numbers.
Take the time to view your results and figure out what you can improve on. For example, if you have a high bounce rate, figure out why consumers are leaving your site way too fast. It could be that the user experience isn’t the best across mobile devices, or the readability of your site needs to be improved.
If you do not have lots of visitors to your site, you might want to do an SEO check to see if your website is on the first page, and higher up in search engine rankings!
Remember, just because you have done the work once, does not mean you forget about it! Continue to monitor the data on your site to continue to improve on the areas needed.
Web analytics does not have to be difficult. By following this guide, you are now one step ahead of your website becoming a success!
You are doing great!
If you are new, don’t worry! Many people have been in your spot and researching the same information that you are currently doing. We all started somewhere. You are doing just fine!
Good Luck!